





Where can I find the U Webinar statistics report and what information I can find in the report?
U Webinar provides a webinar statistics report after a U Webinar has ended. Webinar hosts can analyze the audience distribution in different time sessions as a reference for future presentations.
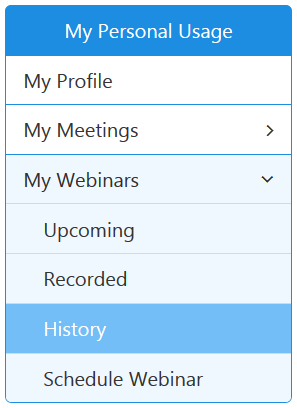
To find the U Webinar report, please visit https://u.cyberlink.com/user/profile and then browse My Webinars > History webpage.
On the webpage, find the webinar you want to view the report for and then click the  button to view it.

The numbers in a U Webinar statistics report are counted by session. A session is when a viewer starts watching the webinar on a given device. For example:
If a user joined a webinar and then leaves the webinar, it will be counted as 1 session. When the user re-joins the webinar, a new session will be counted.
If a viewer used 2 different devices to watch a webinar at the same time, it will be counted as 2 sessions.
In a U Webinar statistics report, you can find the statistical information below
- Basic information: Shows some basic information about the webinar.
- Max. concurrent viewers: The maximum concurrent viewers that watched your webinar at one time.
- Total messages: The total number of messages sent during the webinar.
- Start Time: The start time of the webinar.
- End Time: The end time of the webinar.
- Total session time: Total session time is the cumulative time of all session.
- Avg. session time: The average time of a session.
- Recorded: The recorded webinar video URL.
- Platform Distribution: It shows the distribution of the viewers' devices.
- Total Viewers: The total number of viewers on all devices that watched the webinar.
- U PC: The total sessions via PC version of U Messenger.
- U Mac: The total sessions via Mac version of U Messenger.
- iOS: The total sessions via iOS version of U Messenger.
- Android: The total sessions via Android version of U Messenger.
- Web viewer: The total sessions via a web browser.
- Number of Viewers at Every Minute: The chart shows the number of sessions at every minute during the webinar.
- Number of Messages at Every Minute: The chart shows the number of messages at every minute during the webinar.
- Distribution of Watching Time of Sessions: The chart shows the distribution of watching time of sessions by 10 minutes as the unit.


